Short answer: Across South Brevard, March brings warm afternoons and little rain. Its 1991 to 2020 NOAA normals are 78.5 degrees by day and 54.5 at dawn at the inland Palm Bay co-op station, and 77.1 and 57.7 at Melbourne International Airport, where 2.69 inches of rain is normal. Fire activity climbs through the month, and March 2026 ranked as Melbourne’s 8th warmest March.
Last verified: October 18, 2026, against the sources listed at the end of this page.
What are normal March temperatures in Palm Bay and Melbourne?
March in South Brevard averages a high of 78.5 degrees and a low of 54.5 at the Palm Bay co-op station and 77.1 over 57.7 at Melbourne International Airport, by the 1991 to 2020 normals.
March is the month the region leaves winter behind. The KMLB normal high climbs from 74.0 in February to 77.1 in March and 80.9 in April, while the normal low rises from 54.0 to 57.7 and then 62.8 (ACIS normals, KMLB). Inland at cooperative station USC00086761 in Palm Bay, March mornings stay cooler, with a 54.5 normal low against a 78.5 high (ACIS normals, Palm Bay co-op), a daily swing of 24.0 degrees (78.5 minus 54.5) for the inland ground of Malabar and Grant-Valkaria.
| Station or record | High, F | Low, F | Rain, inches |
|---|---|---|---|
| Palm Bay co-op (USC00086761) | 78.5 | 54.5 | 3.04 |
| Melbourne International Airport (KMLB) | 77.1 | 57.7 | 2.69 |
| Vero Beach airport, reference for Micco and Barefoot Bay | 78.4 | 57.7 | 3.44 |
| KMLB March records, 1939 to 2026 | 93 (March 28, 1994) | 25 (March 3, 1980) | 11.58 (1996) |
The Vero Beach normals (ACIS normals, Vero Beach) are the nearest official benchmark for Micco and Barefoot Bay. The KMLB records in the last row are from the NWS Melbourne March 2026 climate report, which also lists 0.7 days of 90 degrees or more in a normal March (KMLB March 2026 climate report). A freeze is still possible early in the month: the 25 degree record low came on March 3, 1980.
Whole Marches have varied by more than twelve degrees at Melbourne. The warmest March on the airport record averaged 72.7 in 1948 and the coolest 60.2 in 1969 (KMLB March 2024 report), a gap of 12.5 degrees (72.7 minus 60.2).
How dry is March in South Brevard?
March is a dry month in South Brevard, with normal totals of 2.69 inches at Melbourne International Airport, 3.04 at the Palm Bay co-op and 3.44 at the Vero Beach airport, falling on about seven days.
The KMLB normal is 6.8 March days with measurable rain and 0.6 with an inch or more (KMLB March rain normals). NWS Melbourne describes late February through March as the stretch most like spring at higher latitudes, with large temperature swings and occasional severe weather while rainfall is infrequent (NWS Melbourne wet and dry season study). For Palm Bay and Malabar that means long runs of sunny days broken by the rain of a passing cold front.
Extremes at the airport show how far a single March can stray. The wettest March at KMLB brought 11.58 inches in 1996 and the driest only 0.03 inch in 1956 (KMLB March rain records). Most of the 1996 total came early: the daily rainfall record for March at Melbourne is 5.24 inches on March 11, 1996 (KMLB March daily record).
Rain in March 2026 was patchy. Melbourne recorded 3.27 inches against its 2.69 normal, while the Vero Beach station south of Micco measured only 1.77 inches against 3.44 (NWS Melbourne March 2026 rainfall table). The split shows why one gauge rarely speaks for all of South Brevard in the dry season: showers that soak the Melbourne airport can miss Barefoot Bay entirely.
Why is March a fire weather month around Palm Bay and Grant-Valkaria?
March around Palm Bay and Grant-Valkaria combines low rainfall, gusty fronts and months of dry season deficits, on the rising part of a fire season that peaks in May and June.
The Florida Forest Service ties the season to its drought index: fire activity begins increasing in January and peaks in May and June (Florida Forest Service KBDI notes). By that measure March in Palm Bay, Malabar and Grant-Valkaria is two months into the rise and two months short of the peak.
Spring 2026 showed the pattern at full strength. In an April 7, 2026 update, the Florida Forest Service counted over 1,500 wildfires that had burned over 54,000 acres in Florida since January, with 20 counties under burn bans and several areas under Red Flag Warnings from the National Weather Service (Florida Forest Service wildfire update, April 2026). NWS Melbourne later reported that rainfall deficits through the dry season, since early November, kept moderate to extreme drought across east central Florida, the region that includes Palm Bay and Micco (NWS Melbourne Spring 2026 summary).
Wind is the other ingredient. Average wind speed at Melbourne International Airport in March 2026 was 10.6 mph, and gusts reached 46 mph on March 15 and again on March 16 as a strong front crossed (KMLB March 2026 wind). The same update recalls the 1998 season, when more than half a million acres burned in Florida and 337 structures were damaged or destroyed; Florida Wildfire Awareness Week, the first full week of April, was set up in recognition of it.
What severe weather has March brought to Brevard?
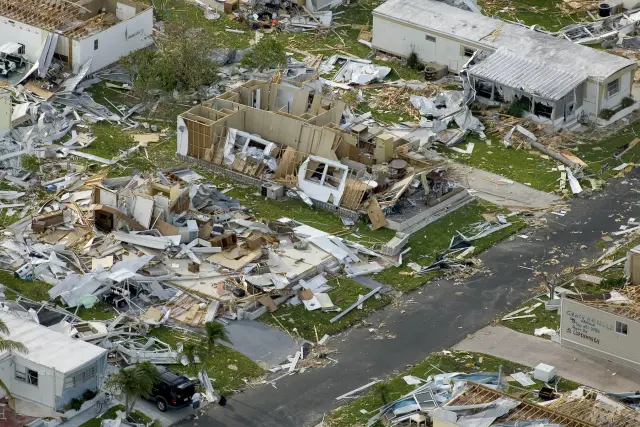
March falls in the time of year when the Florida peninsula sees most of its significant severe weather, and NWS Melbourne's event log lists March tornadoes at Melbourne, Merritt Island and Cocoa Beach.
The NWS Melbourne lightning climatology notes that March is the time of year when the peninsula sees most of its significant severe weather, along with an increase in lightning (NWS Melbourne lightning climatology).
On the morning of March 24, 1983 a strong squall line produced tornadoes at Cocoa Beach, Merritt Island and Melbourne in Brevard County (NWS Melbourne March event log, 1983). On March 6, 1992 severe thunderstorm winds caused damage in Orange, Seminole, Brevard and Indian River Counties (NWS Melbourne March event log, 1992). On March 30, 1996 a waterspout or tornado touched down at Merritt Island and Cape Canaveral, and golf ball size hail of 1.75 inches fell in Brevard and six other counties (NWS Melbourne March event log, 1996).
The log's entry for March 12 and 13, 1993 is the Storm of the Century, when a severe squall line raced east across the state at over 50 mph ahead of an intense low, and record or near record low temperatures followed over much of Florida for two nights (NWS Melbourne March event log, 1993). Its storm surge was unprecedented for the Gulf Coast, while the squall line itself moved through the state.
How did March 2026 compare with recent Marches at Melbourne?
March 2026 averaged 71.6 degrees at Melbourne International Airport, 4.2 above normal and the 8th warmest March on record there, after a mild March 2025 and a dry March 2024.
| March | Mean, F | Average high, F | Average low, F | Rain, inches |
|---|---|---|---|---|
| 2023 | 72.6 | 82.5 | 62.8 | 1.16 |
| 2024 | 70.5 | 79.2 | 61.8 | 0.63 |
| 2025 | 68.0 | 78.6 | 57.4 | 1.56 |
| 2026 | 71.6 | 79.2 | 63.9 | 3.27 |
| Normal, 1991 to 2020 | 67.4 | 77.1 | 57.7 | 2.69 |
The 2023 and 2024 rows are from the KMLB report issued April 1, 2024 (KMLB March 2024 report), and the 2025 and 2026 rows from the report issued April 1, 2026 (KMLB March 2026 report). Every one of the four Marches ran warmer than the 67.4 normal at Melbourne, and three of the four were drier, which matches the fire weather pattern of recent springs around Palm Bay.
The ranking comes from NWS Melbourne, which placed Melbourne's March 2026 average of 71.6 as its 8th warmest (NWS Melbourne March 2026 rankings). The first half of the month was extreme, with numerous record highs and warm minimums across the area, until a strong cold front late on March 16 made St. Patrick's Day one of the coolest on record (NWS Melbourne March 2026 summary). Melbourne itself tied the daily warm low record of 71 for March 5, set in 2022, and set a new daily mark of 72 for March 14, beating 71 from 1954 (NWS Melbourne March 2026 records). The coldest morning of the month at the airport, 48 degrees, followed the front on March 17.
How warm is the ocean off South Brevard in March?
Shore water near Port Canaveral averages 74.4 degrees in March, warmer than the 72.0 at the buoy 20 nautical miles east of Cape Canaveral, so March is when the coast off Melbourne Beach and Micco starts to warm faster than the open Atlantic.
In February the order is reversed: Trident Pier averages 68.9 and the Canaveral buoy 71.8 (NOAA NCEI water temperature table). Between February and March the Trident Pier average gains 5.5 degrees (74.4 minus 68.9) while the offshore buoy gains only 0.2 (72.0 minus 71.8). Trident Pier is the shore gauge in the NOAA table nearest the beaches east of Malabar and Palm Bay.
March can still bring rough surf to the South Brevard beaches. During the storm of March 7 to 9, 1962, large waves from an intense Atlantic storm pounded the entire east Florida coast with tides 2 to 3 feet above normal, and the greatest damages occurred between Melbourne and Miami Beach (NWS Melbourne March event log, 1962), a stretch that takes in the barrier island east of Malabar and the beaches near Barefoot Bay.
Frequently asked questions
What is the average temperature in Palm Bay in March?
March days at the Palm Bay co-op station normally peak at 78.5 degrees and bottom out at 54.5, by the 1991 to 2020 normals. Melbourne International Airport has a monthly mean of 67.4 degrees, from a 77.1 high and a 57.7 low.
Does it rain much in March in Melbourne and Palm Bay?
Not usually. Melbourne International Airport averages 2.69 inches over about seven days with rain, and the Palm Bay co-op 3.04. The record ranges from 0.03 inch in 1956 to 11.58 inches in 1996.
Is March wildfire season in South Brevard?
March falls in the rising part of the Florida fire season, which the Florida Forest Service says increases from January and peaks in May and June. In spring 2026, over 1,500 Florida wildfires had burned over 54,000 acres by early April.
What is the hottest March temperature recorded at Melbourne?
The March record at Melbourne International Airport is 93 degrees, set on March 28, 1994. The record low for the month is 25 degrees, set on March 3, 1980.
Sources
- NOAA Regional Climate Centers ACIS, 1991-2020 monthly normals, Palm Bay cooperative station (USC00086761) https://data.rcc-acis.org/StnData?params=%7B%22sid%22%3A%22086761%22%2C%22sdate%22%3A%222020-01%22%2C%22edate%22%3A%222020-12%22%2C%22elems%22%3A%5B%7B%22name%22%3A%22maxt%22%2C%22interval%22%3A%22mly%22%2C%22duration%22%3A%22mly%22%2C%22reduce%22%3A%22mean%22%2C%22normal%22%3A%2291%22%7D%2C%7B%22name%22%3A%22mint%22%2C%22interval%22%3A%22mly%22%2C%22duration%22%3A%22mly%22%2C%22reduce%22%3A%22mean%22%2C%22normal%22%3A%2291%22%7D%2C%7B%22name%22%3A%22pcpn%22%2C%22interval%22%3A%22mly%22%2C%22duration%22%3A%22mly%22%2C%22reduce%22%3A%22sum%22%2C%22normal%22%3A%2291%22%7D%5D%7D Used for: March normal high, low and rainfall in Palm Bay
- NOAA Regional Climate Centers ACIS, 1991-2020 monthly normals, Melbourne International Airport (USW00012838) https://data.rcc-acis.org/StnData?params=%7B%22sid%22%3A%22USW00012838%22%2C%22sdate%22%3A%222020-01%22%2C%22edate%22%3A%222020-12%22%2C%22elems%22%3A%5B%7B%22name%22%3A%22maxt%22%2C%22interval%22%3A%22mly%22%2C%22duration%22%3A%22mly%22%2C%22reduce%22%3A%22mean%22%2C%22normal%22%3A%2291%22%7D%2C%7B%22name%22%3A%22mint%22%2C%22interval%22%3A%22mly%22%2C%22duration%22%3A%22mly%22%2C%22reduce%22%3A%22mean%22%2C%22normal%22%3A%2291%22%7D%2C%7B%22name%22%3A%22pcpn%22%2C%22interval%22%3A%22mly%22%2C%22duration%22%3A%22mly%22%2C%22reduce%22%3A%22sum%22%2C%22normal%22%3A%2291%22%7D%5D%7D Used for: March normals at KMLB; February and April comparison
- NOAA Regional Climate Centers ACIS, 1991-2020 monthly normals, Vero Beach airport (USW00012843) https://data.rcc-acis.org/StnData?params=%7B%22sid%22%3A%22USW00012843%22%2C%22sdate%22%3A%222020-01%22%2C%22edate%22%3A%222020-12%22%2C%22elems%22%3A%5B%7B%22name%22%3A%22maxt%22%2C%22interval%22%3A%22mly%22%2C%22duration%22%3A%22mly%22%2C%22reduce%22%3A%22mean%22%2C%22normal%22%3A%2291%22%7D%2C%7B%22name%22%3A%22mint%22%2C%22interval%22%3A%22mly%22%2C%22duration%22%3A%22mly%22%2C%22reduce%22%3A%22mean%22%2C%22normal%22%3A%2291%22%7D%2C%7B%22name%22%3A%22pcpn%22%2C%22interval%22%3A%22mly%22%2C%22duration%22%3A%22mly%22%2C%22reduce%22%3A%22sum%22%2C%22normal%22%3A%2291%22%7D%5D%7D Used for: March reference normals for Micco and Barefoot Bay
- NWS Melbourne climate report for the month of March 2026, Melbourne (CLMMLB, issued April 1, 2026; Iowa Environmental Mesonet text archive) https://mesonet.agron.iastate.edu/cgi-bin/afos/retrieve.py?pil=CLMMLB&sdate=2026-04-01&edate=2026-04-03&fmt=html&limit=1 Used for: March records, rainfall extremes, March 2026 and 2025 values at KMLB
- NWS Melbourne climate report for the month of March 2024, Melbourne (CLMMLB, issued April 1, 2024; Iowa Environmental Mesonet text archive) https://mesonet.agron.iastate.edu/cgi-bin/afos/retrieve.py?pil=CLMMLB&sdate=2024-04-01&edate=2024-04-03&fmt=html&limit=1 Used for: warmest and coolest Marches, daily rainfall record, March 2024 and 2023
- NWS Melbourne, March 2026 Weather Summary, East Central Florida, page 2 https://www.weather.gov/media/mlb/summary/Mar2026.pdf#page=2 Used for: record warmth and the St. Patrick Day cold front
- NWS Melbourne, March 2026 Weather Summary, page 3 https://www.weather.gov/media/mlb/summary/Mar2026.pdf#page=3 Used for: Melbourne eighth warmest March
- NWS Melbourne, March 2026 Weather Summary, page 5 https://www.weather.gov/media/mlb/summary/Mar2026.pdf#page=5 Used for: Melbourne warm low records
- NWS Melbourne, March 2026 Weather Summary, page 8 https://www.weather.gov/media/mlb/summary/Mar2026.pdf#page=8 Used for: March 2026 rainfall by station
- NWS Melbourne, May 2026 and Spring 2026 Weather Summary, page 13 https://www.weather.gov/media/mlb/summary/MaySpring2026.pdf#page=13 Used for: dry season deficits and drought through spring 2026
- Florida Department of Agriculture and Consumer Services, Florida Forest Service: KBDI as an Indicator of Potential Wildfire Activity https://www.fdacs.gov/Forest-Wildfire/Wildland-Fire/Keetch-Byram-Drought-Index-KBDI/KBDI-as-an-Indicator-of-Potential-Wildfire-Activity Used for: fire season timing
- Florida Division of Emergency Management, Florida Forest Service wildfire conditions release, April 8, 2026 https://www.floridadisaster.org/news-media/news/20260408-icymi-commissioner-wilton-simpson-florida-forest-service-highlight-current-wildfire-conditions-and-urge-residents-to-be-wildfire-ready/ Used for: 2026 wildfire count, burn bans, 1998 season
- NWS Melbourne, The Onset of the Wet and Dry Seasons in East Central Florida, page 1 https://www.weather.gov/media/mlb/climate/wetdryseason.pdf#page=1 Used for: late February through March as the spring-like period
- NWS Melbourne, Florida lightning climatology by month https://www.weather.gov/mlb/fl_lightning_climo Used for: March severe weather and lightning
- NWS Melbourne, Florida Hazardous Weather Events in March, page 2 https://www.weather.gov/media/mlb/whirl/FloridaHazardousWeather_Mar.pdf#page=2 Used for: 1962 coastal storm and 1992 thunderstorm winds
- NWS Melbourne, Florida Hazardous Weather Events in March, page 3 https://www.weather.gov/media/mlb/whirl/FloridaHazardousWeather_Mar.pdf#page=3 Used for: Storm of the Century, March 12-13, 1993
- NWS Melbourne, Florida Hazardous Weather Events in March, page 6 https://www.weather.gov/media/mlb/whirl/FloridaHazardousWeather_Mar.pdf#page=6 Used for: March 24, 1983 tornadoes in Brevard
- NWS Melbourne, Florida Hazardous Weather Events in March, page 8 https://www.weather.gov/media/mlb/whirl/FloridaHazardousWeather_Mar.pdf#page=8 Used for: March 30, 1996 Merritt Island tornado and Brevard hail
- NOAA NCEI Coastal Water Temperature Guide, all stations table https://www.ncei.noaa.gov/access/coastal-water-temperature-guide/all_table.html Used for: March water temperatures at Trident Pier and the Canaveral buoy
How this page was made
Digital Towns uses AI assistance to research and write its guides, and every page is only as good as the sources it cites. Our goal is the most accurate, useful local information possible.
This page was fact-checked twice before publishing.
If you see an error, or anything you can show is false, tell us right away and we will take a third look.
Report an error
Thank you. We'll take a third look and correct the page if it's wrong.