Short answer: South Brevard is hot and wet from late May to mid October and mild and dry the rest of the year. Melbourne International Airport averages 81.5 degrees by day, 64.6 at night and 50.79 inches of rain a year. Twelve month guides cover January through December at the Palm Bay and Melbourne stations, and the hurricane history guide covers the storms.
Last verified: October 18, 2026, against the sources listed at the end of this page.
What is the weather like in South Brevard through the year?
South Brevard has long, hot, wet summers and mild, dry winters: Melbourne International Airport averages 81.5 degrees by day and 64.6 at night across the year, with 50.79 inches of rain and 62.8 days of 90 or hotter.
Those annual normals for 1991 to 2020 are printed in the KMLB annual climate report for 2025, which also gives 1.8 nights at or below freezing in a normal year and 119.5 days with measurable rain (NWS Melbourne 2025 annual report for KMLB). KMLB is the station whose current conditions appear on the National Weather Service forecast page for Palm Bay (Palm Bay point forecast), which makes it the reference reading for Palm Bay, Malabar and Grant-Valkaria throughout these guides.
Inland ground runs to wider extremes. The Palm Bay cooperative station USC00086761 averages 91.8 degrees on August afternoons and 49.0 on January mornings (ACIS normals, Palm Bay co-op), against 89.3 and 51.7 at the airport closer to the Indian River Lagoon (ACIS normals, KMLB). For Micco and Barefoot Bay, the Vero Beach airport normals run from 52.2 on January nights to 90.6 on August afternoons (ACIS normals, Vero Beach).
Each month guide below takes one month at a time: its normals at the Palm Bay and Melbourne stations, its records, the last few years, and the hazards of that month, from January freezes to the September peak of hurricane season.
Which South Brevard weather guide answers which question?
Twelve month guides cover January through December for Palm Bay, Malabar, Grant-Valkaria, Micco and Barefoot Bay, and the South Brevard hurricane history guide covers the storms; the table matches each to the question it answers.
| Month or topic | Guide | Question it answers | Defining figure |
|---|---|---|---|
| January | January weather guide | How cold does it get, and how often does it freeze? | Coldest month; Palm Bay co-op normal low 49.0 |
| February | February weather guide | Is February the driest month? | Driest month at KMLB, 1.98 inches |
| March | March weather guide | How dry and windy is the dry season at its height? | KMLB normal high 77.1, rain 2.69 inches |
| April | April weather guide | How fast does spring warm up? | KMLB normal high 80.9, rain 2.29 inches |
| May | May weather guide | When does the rainy season start? | Wet season median start May 28 at Melbourne |
| June | June weather guide | How much wetter is June than May? | KMLB rain 7.10 inches, against 3.53 in May |
| July | July weather guide | How hot is the hottest stretch at the airport? | KMLB normal high 89.7, its highest of the year |
| August | August weather guide | How hot and stormy is late summer inland? | Palm Bay co-op normal high 91.8 |
| September | September weather guide | Why is September the wettest month? | Palm Bay co-op 7.95 inches, KMLB 7.63 |
| October | October weather guide | When does the dry season return? | Dry season median start October 17 at Melbourne |
| November | November weather guide | When do cool nights come back? | First reading below 50 by November 10 at Melbourne |
| December | December weather guide | How mild is December? | KMLB normal high 73.9, low 55.6 |
| Storms | South Brevard hurricane history guide | Which hurricanes and tropical storms have hit South Brevard? | Season runs June 1 to November 30 |
The defining figures come from the 1991 to 2020 normals for Melbourne International Airport and the Palm Bay co-op (KMLB monthly normals; Palm Bay co-op monthly normals) and from the NWS Melbourne season onset dates (NWS Melbourne onset table). Two facts stand out in the KMLB column: February, not April, is the driest month at the airport, and July, not August, has the highest normal high there, while the inland Palm Bay co-op peaks in August at 91.8.
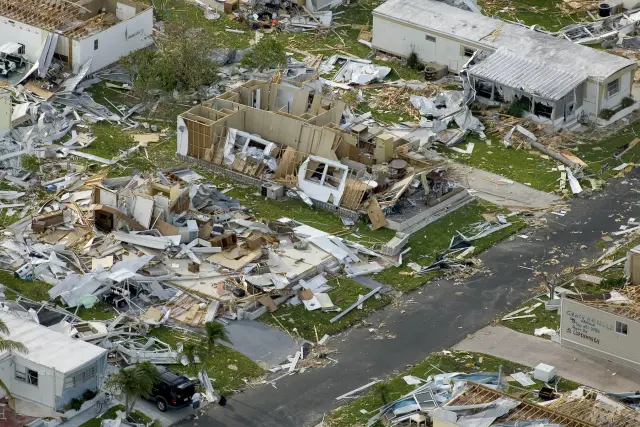
A separate guide covers Hurricanes Frances and Jeanne of September 2004, and it sits beside the hurricane history guide in the South Brevard disasters section. Together they answer the storm questions for Palm Bay and the coast from Melbourne Beach to Micco that the month guides leave out.
When are the rainy season and the dry season in South Brevard?
The rainy season in South Brevard runs from about May 28 to October 17 at Melbourne, the median start dates NWS Melbourne computed from records since 1950, with Vero Beach a few days earlier and later at May 26 and October 19.
Those dates are medians, so half of all years start earlier and half later (NWS Melbourne wet and dry season onset). The office's study explains the two turning points: rainfall frequency usually begins to increase in late May, and the dry season usually begins in October as the first synoptic scale cold front brings drier and slightly cooler air into east central Florida, the region that includes Palm Bay (NWS Melbourne season study).
The split is lopsided. A 22 year record from a north Melbourne rain gauge found nearly two thirds of the yearly rain fell in a wet season about 138 days long, or 64 percent of the rain in 38 percent of the year (NWS Melbourne wet season statistics). The monthly normals show the same jump at KMLB, from 3.53 inches in May to 7.10 in June (ACIS normals, KMLB May and June), and the dry season months of November through April each bring less than 3 inches at the Melbourne airport.
Cool weather has its own calendar at Melbourne. The first reading below 60 degrees comes by October 22 and the first below 50 by November 10 in a typical year, with Vero Beach, the station nearest Barefoot Bay, at November 13 for the 50 degree mark (NWS Melbourne cool season dates).
When is hurricane season in South Brevard, and where is the storm history?
Hurricane season for Palm Bay, Malabar, Grant-Valkaria, Micco and Barefoot Bay is the Atlantic season of June 1 to November 30, and the South Brevard hurricane history guide lists the storms that have struck the region.
The National Hurricane Center gives a 1991 to 2020 average of 14 named storms, 7 hurricanes and 3 major hurricanes a season, with the peak on September 10 and most activity between mid August and mid October (National Hurricane Center climatology). That peak lands in September, the wettest month at both South Brevard stations: 7.95 inches at the Palm Bay co-op and 7.63 at Melbourne International Airport.
Tropical rain is a real share of the total even in quiet years. For 1992 to 2013, tropical systems supplied 15 percent of wet season rain and 10 percent of the yearly total at the north Melbourne gauge, about 5 inches a year, though in many years they bring little or none (NWS Melbourne tropical rainfall share).
The hurricane history guide answers which hurricanes and tropical storms have hit Palm Bay, Malabar, Grant-Valkaria, Micco and Barefoot Bay, and the Frances and Jeanne guide follows the two 2004 storms in detail. The May guide covers storm preparation before June 1.
How hot and how cold has South Brevard been?
The extremes at Melbourne International Airport are 102 degrees on July 14, 1980 and 19 degrees on January 20, 1977, across a record that runs from 1939 to 2025.
Rainfall swings as widely. The wettest year at KMLB brought 74.28 inches in 1947 and the driest 31.97 inches in 1981 (KMLB annual records), a range of more than 42 inches (74.28 minus 31.97) around the 50.79 inch normal at the airport.
| Item | 2025 | Normal | 2024 |
|---|---|---|---|
| Rain, inches | 53.35 | 50.79 | 40.46 |
| Days 90 degrees or hotter | 64 | 62.8 | 91 |
| Nights 32 degrees or colder | 0 | 1.8 | 0 |
| Mean temperature, F | 73.9 | 73.1 | 74.4 |
The 2025 report shows how one year can sit near normal while the year before did not: Melbourne had 91 days of 90 or hotter in 2024 but 64 in 2025, and rain rose from 40.46 inches to 53.35 (KMLB 2025 annual report). The hottest reading of 2025 at the airport was 96 on May 21 and the coldest 35 on December 31, so 2025 passed without a freeze at KMLB. Thunder was heard on 93 days, and the strongest gust, 61 mph, came on March 31.
Which weather stations and offices stand behind South Brevard numbers?
The South Brevard guides rely on three NOAA stations, Melbourne International Airport, the Palm Bay cooperative station and the Vero Beach airport, and on the NWS Melbourne office that issues every forecast and climate report for the region.
NWS Melbourne works from 421 Croton Road, Melbourne, phone 321-255-0212, and its station digest lists Palm Bay among the communities a short distance from the office and Grant/Valkaria among those a slightly longer commute to the south (NWS Melbourne station digest). The Palm Bay co-op appears in the NOAA climate record as station PALM BAY, USC00086761, at an elevation of 27 feet (ACIS station record, Palm Bay), while the airport sits at 22 feet (ACIS station record, KMLB).
No live readings appear in these guides. Every number is a 1991 to 2020 normal, a record or a past month from an NWS Melbourne climate report, and each guide names the station behind every figure, so a reader in Malabar can tell an inland Palm Bay number from an airport one. For a forecast, the National Weather Service page for Palm Bay is the official source.
Frequently asked questions
What is the rainy season in Palm Bay and South Brevard?
The wet season runs from a median start of May 28 to October 17 at Melbourne, by NWS Melbourne figures, with Vero Beach near Barefoot Bay at May 26 and October 19. Nearly two thirds of the yearly rain falls in that stretch.
What is the coldest month in South Brevard?
January. Its 1991 to 2020 normal low is 49.0 degrees at the Palm Bay co-op and 51.7 at Melbourne International Airport, and the airport averages 1.2 of its 1.8 yearly freezing nights in January.
What is the hottest temperature ever recorded in Melbourne, Florida?
Melbourne International Airport reached 102 degrees on July 14, 1980, the highest reading in a record that begins in 1939. The coldest was 19 degrees on January 20, 1977.
How much rain does Palm Bay get in a year?
Melbourne International Airport, the station whose current conditions appear on the National Weather Service forecast page for Palm Bay, averages 50.79 inches a year by the 1991 to 2020 normals. The wettest month there is September at 7.63 inches and the driest February at 1.98.
Sources
- NWS Melbourne climate report for the year 2025, Melbourne (CLAMLB, issued January 1, 2026; Iowa Environmental Mesonet text archive) https://mesonet.agron.iastate.edu/cgi-bin/afos/retrieve.py?pil=CLAMLB&sdate=2026-01-01&edate=2026-01-05&fmt=html&limit=1 Used for: annual normals, all-time records and 2025 totals at KMLB
- NOAA Regional Climate Centers ACIS, 1991-2020 monthly normals, Palm Bay cooperative station (USC00086761) https://data.rcc-acis.org/StnData?params=%7B%22sid%22%3A%22086761%22%2C%22sdate%22%3A%222020-01%22%2C%22edate%22%3A%222020-12%22%2C%22elems%22%3A%5B%7B%22name%22%3A%22maxt%22%2C%22interval%22%3A%22mly%22%2C%22duration%22%3A%22mly%22%2C%22reduce%22%3A%22mean%22%2C%22normal%22%3A%2291%22%7D%2C%7B%22name%22%3A%22mint%22%2C%22interval%22%3A%22mly%22%2C%22duration%22%3A%22mly%22%2C%22reduce%22%3A%22mean%22%2C%22normal%22%3A%2291%22%7D%2C%7B%22name%22%3A%22pcpn%22%2C%22interval%22%3A%22mly%22%2C%22duration%22%3A%22mly%22%2C%22reduce%22%3A%22sum%22%2C%22normal%22%3A%2291%22%7D%5D%7D Used for: month by month normals in Palm Bay
- NOAA Regional Climate Centers ACIS, 1991-2020 monthly normals, Melbourne International Airport (USW00012838) https://data.rcc-acis.org/StnData?params=%7B%22sid%22%3A%22USW00012838%22%2C%22sdate%22%3A%222020-01%22%2C%22edate%22%3A%222020-12%22%2C%22elems%22%3A%5B%7B%22name%22%3A%22maxt%22%2C%22interval%22%3A%22mly%22%2C%22duration%22%3A%22mly%22%2C%22reduce%22%3A%22mean%22%2C%22normal%22%3A%2291%22%7D%2C%7B%22name%22%3A%22mint%22%2C%22interval%22%3A%22mly%22%2C%22duration%22%3A%22mly%22%2C%22reduce%22%3A%22mean%22%2C%22normal%22%3A%2291%22%7D%2C%7B%22name%22%3A%22pcpn%22%2C%22interval%22%3A%22mly%22%2C%22duration%22%3A%22mly%22%2C%22reduce%22%3A%22sum%22%2C%22normal%22%3A%2291%22%7D%5D%7D Used for: month by month normals at KMLB
- NOAA Regional Climate Centers ACIS, 1991-2020 monthly normals, Vero Beach airport (USW00012843) https://data.rcc-acis.org/StnData?params=%7B%22sid%22%3A%22USW00012843%22%2C%22sdate%22%3A%222020-01%22%2C%22edate%22%3A%222020-12%22%2C%22elems%22%3A%5B%7B%22name%22%3A%22maxt%22%2C%22interval%22%3A%22mly%22%2C%22duration%22%3A%22mly%22%2C%22reduce%22%3A%22mean%22%2C%22normal%22%3A%2291%22%7D%2C%7B%22name%22%3A%22mint%22%2C%22interval%22%3A%22mly%22%2C%22duration%22%3A%22mly%22%2C%22reduce%22%3A%22mean%22%2C%22normal%22%3A%2291%22%7D%2C%7B%22name%22%3A%22pcpn%22%2C%22interval%22%3A%22mly%22%2C%22duration%22%3A%22mly%22%2C%22reduce%22%3A%22sum%22%2C%22normal%22%3A%2291%22%7D%5D%7D Used for: reference normals for Micco and Barefoot Bay
- NWS Melbourne, Wet/Dry Season Onset https://www.weather.gov/mlb/wetdry Used for: median wet and dry season start dates
- NWS Melbourne, The Onset of the Wet and Dry Seasons in East Central Florida, page 1 https://www.weather.gov/media/mlb/climate/wetdryseason.pdf#page=1 Used for: late May rain increase and October dry season start
- NWS Melbourne, Some Wet Season Statistics from North Melbourne, Florida https://www.weather.gov/mlb/wet_stats Used for: share of yearly rain in the wet season and from tropical systems
- National Hurricane Center, Tropical Cyclone Climatology https://www.nhc.noaa.gov/climo/ Used for: hurricane season dates, averages and peak
- National Weather Service point forecast, Palm Bay FL https://forecast.weather.gov/MapClick.php?lat=27.9931&lon=-80.6608 Used for: Palm Bay forecast uses Melbourne International Airport observations
- NWS Melbourne Station Digest https://www.weather.gov/mlb/station_digest Used for: office address and nearby communities including Palm Bay and Grant/Valkaria
How this page was made
Digital Towns uses AI assistance to research and write its guides, and every page is only as good as the sources it cites. Our goal is the most accurate, useful local information possible.
This page was fact-checked twice before publishing.
If you see an error, or anything you can show is false, tell us right away and we will take a third look.
Report an error
Thank you. We'll take a third look and correct the page if it's wrong.