Short answer: May in South Brevard is hot and mostly dry until the rainy season arrives near May 28. Inland, the Palm Bay co-op station's 1991 to 2020 NOAA normals are 86.6 degrees in the afternoon and 65.4 at dawn, while Melbourne International Airport averages 84.9 and 68.6 with 3.53 inches of rain. May 2026 was the warmest May on record at Melbourne.
Last verified: October 18, 2026, against the sources listed at the end of this page.
How hot does May get in Palm Bay and Melbourne?
May normals reach 86.6 degrees by day and 65.4 at night at the Palm Bay co-op station and 84.9 over 68.6 at Melbourne International Airport, which averages 4.5 May days of 90 or hotter.
The Palm Bay figures are from cooperative station USC00086761 (ACIS normals, Palm Bay co-op) and the airport figures from the same NOAA 1991 to 2020 set (ACIS normals, KMLB). The inland Palm Bay gauge runs 1.7 degrees hotter in the afternoon than KMLB (86.6 minus 84.9) but 3.2 degrees cooler at dawn (68.6 minus 65.4).
| Station or record | High, F | Low, F | Rain, inches |
|---|---|---|---|
| Palm Bay co-op (USC00086761) | 86.6 | 65.4 | 4.37 |
| Melbourne International Airport (KMLB) | 84.9 | 68.6 | 3.53 |
| Vero Beach airport, reference for Micco and Barefoot Bay | 85.7 | 67.8 | 4.20 |
| KMLB May records, 1939 to 2026 | 99 (May 31, 2004) | 47 (May 8, 1992) | 13.83 (1976) |
The record row and the 4.5 hot day normal come from the NWS Melbourne May 2026 climate report (KMLB May 2026 climate report). Vero Beach, the official benchmark for Micco and Barefoot Bay, sits between the two Brevard stations at 85.7 and 67.8 (ACIS normals, Vero Beach).
May can be hotter than the summer months that follow. NWS Melbourne notes that the hottest temperatures of the season sometimes come in May or June, before rain becomes frequent, and that, in the study's records, the hottest month at Melbourne was June 1998, in the middle of a prolonged dry spell (NWS Melbourne season study, page 4). The ocean warms too: Trident Pier at Port Canaveral averages 80.2 degrees in May and the Canaveral buoy 77.4 (NOAA NCEI water temperature table), so shore water near the South Brevard beaches is already around 80 before June begins.
When does the rainy season start in South Brevard?
The wet season starts on May 28 at Melbourne and May 26 at Vero Beach in a typical year, the median onset dates NWS Melbourne computed from records back to 1950.
Orlando's median is May 27 (NWS Melbourne wet and dry season onset), so Melbourne, Vero Beach and Orlando normally turn wet in the last days of May. Half of all years start earlier and half later; the same table puts the return of the dry season at Melbourne on October 17.
The change is a jump, not a ramp. NWS Melbourne explains that rainfall frequency usually begins to increase in late May, though the start is sometimes delayed into June and, in rare cases, as late as early July, as in 1998 (NWS Melbourne season study, page 1). The airport normals show the jump: Melbourne International Airport averages 3.53 inches in May and 7.10 in June (ACIS normals, KMLB May and June), and the June normal low of 73.1 is 4.5 degrees warmer than May's 68.6.
Lightning follows the same calendar. The NWS Melbourne lightning climatology describes a rapid increase of lightning in May, with most of it from thunderstorms that form along the sea breezes (NWS Melbourne lightning climatology); in Palm Bay and Malabar the storms of late May are the first of that summer pattern.
How much rain falls in May in Palm Bay, Micco and Barefoot Bay?
Normal May rainfall is 4.37 inches at the Palm Bay co-op, 3.53 at Melbourne International Airport and 4.20 at the Vero Beach airport near Micco and Barefoot Bay.
NWS Melbourne notes that the most notable increase in rainfall frequency usually begins late in the month (NWS Melbourne season study). At KMLB, May brings measurable rain on 8.5 days in a normal year and an inch or more on 1.2 (KMLB May rain normals). The extremes are far apart: the wettest May at the airport brought 13.83 inches in 1976, and the driest only 0.17 inch in 1965.
May 2026 ran dry at Melbourne and Vero Beach. Melbourne measured 2.40 inches against its 3.53 normal and Vero Beach 2.53 against 4.20 (NWS Melbourne May 2026 rainfall table), though KMLB counted thunderstorms on 9 days and measurable rain on 11 (KMLB May 2026 report). No May 2026 day at the airport reached an inch, against 1.2 such days in a normal May.
Dry Mays raise fire danger at the worst time. The Florida Forest Service notes that fire activity peaks in May and June (Florida Forest Service KBDI notes), so May in Grant-Valkaria, Malabar and western Palm Bay falls inside the peak fire window until the wet season takes hold.
Was May 2026 the warmest May on record at Melbourne?
Yes: May 2026 averaged 80.6 degrees at Melbourne, the warmest May on record there, beating 80.3 from May 2024, and Vero Beach tied its own warmest May at 80.1.
NWS Melbourne reported the ranking in its May 2026 summary (NWS Melbourne May 2026 rankings). The record nights stood out most: Melbourne set a daily warm low record of 80 on May 26, beating 79 from 2015 and the all-time record warm minimum for May at the site, and a daily record high of 97 on May 9, beating 94 from 1978 (NWS Melbourne May 2026 records). The whole spring, March to May, ranked second warmest on record at both Melbourne and Vero Beach (NWS Melbourne Spring 2026 summary).
| May | Mean, F | Average high, F | Average low, F | Days 90 or hotter | Rain, inches |
|---|---|---|---|---|---|
| 2023 | 77.0 | 84.8 | 69.1 | 1 | 4.80 |
| 2024 | 80.3 | 88.9 | 71.7 | 14 | 1.12 |
| 2025 | 79.9 | 87.9 | 71.9 | 12 | 4.43 |
| 2026 | 80.6 | 87.5 | 73.7 | 8 | 2.40 |
| Normal, 1991 to 2020 | 76.8 | 84.9 | 68.6 | 4.5 | 3.53 |
The 2023 and 2024 rows are from the KMLB report issued June 1, 2024 (KMLB May 2024 report) and the 2025 and 2026 rows from the one issued June 1, 2026 (KMLB May 2026 report). Three of the last four Mays at Melbourne averaged more than 3 degrees above the 76.8 normal, and May 2024, with 14 days of 90 or hotter and only 1.12 inches of rain, peaked at 98 on May 27. In 2026 the heat showed in the nights: the average low of 73.7 was 5.1 degrees above normal (73.7 minus 68.6).
What severe storms has May brought to South Brevard and the Sebastian River area?
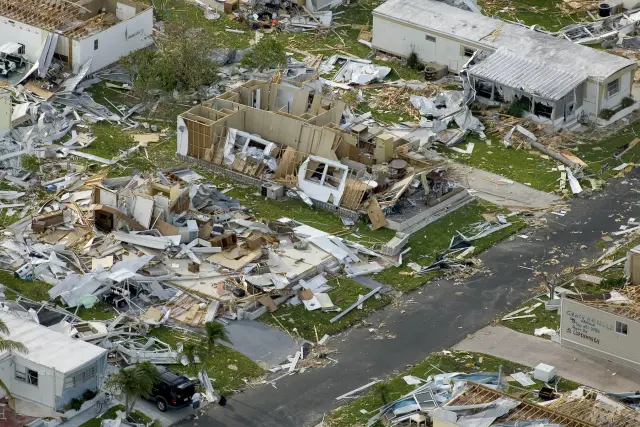
May lightning comes mainly from sea breeze thunderstorms, and the NWS Melbourne event log records damaging May storms at Roseland, Sebastian, Vero Beach and across Brevard.
Early on May 3, 1964 thunderstorm winds unroofed two houses and damaged other homes and commercial buildings at Roseland in Indian River County (NWS Melbourne May event log, 1964). On the night of May 8, 1977 a line of severe thunderstorms moved through St. Lucie, Indian River and Brevard Counties with hail and gusty winds, lightning set a fire at a tire store in Vero Beach, and winds up to 50 mph were measured at Kennedy Space Center (NWS Melbourne May event log, 1977).
On May 30, 1996 thunderstorm winds overturned and destroyed a 20 passenger airplane at the Sebastian Airport and on May 31, 1991 hail from nickel to golf ball size fell in Brevard and four other counties (NWS Melbourne May event log, 1991 and 1996). At Melbourne International Airport the strongest gust of May 2026, 45 mph, came on May 31 (KMLB May 2026 wind).
What should South Brevard residents do in May before hurricane season?
May is the last month before the Atlantic hurricane season opens on June 1, which makes it the month for households in Palm Bay, Malabar, Grant-Valkaria, Micco and Barefoot Bay to check an evacuation zone and stock storm supplies.
The National Hurricane Center sets the Atlantic season at June 1 to November 30, with a 1991 to 2020 average of 14 named storms, 7 hurricanes and 3 major hurricanes, and a peak on September 10 (National Hurricane Center climatology). The center adds that tropical cyclones sometimes form before and after those dates, so a May checklist for a home in Micco or Barefoot Bay is not early.
Several storm supplies no longer need a tax holiday in Palm Bay or Barefoot Bay. Effective August 1, 2025, items once exempted only during past tax holidays are always exempt from Florida sales tax, among them portable generators capable of producing 10,000 running watts or less, portable gas or diesel fuel cans with a capacity of 5 gallons or less, AA, AAA, C, D, 6 volt and 9 volt batteries, ground anchor systems and tie down kits, and waterproof tarps and sheeting of 1,000 square feet or less (Florida Department of Revenue TIP 25A01-05).
Evacuation zones come next. The Florida Division of Emergency Management's evacuation zone lookup takes an address, such as one in Palm Bay or Barefoot Bay, or a device location, and shows designated evacuation zones, which most coastal Florida counties have and interior counties do not; the same page lists a county evacuation route and zone map for Brevard and states that during an emergency the local emergency management program should always be consulted regarding evacuation orders (Florida Disaster Preparedness Maps). The South Brevard hurricane history guide covers the storms that have struck the region, and the June guide picks up the season itself.
Frequently asked questions
When does the rainy season start in Palm Bay and Melbourne?
NWS Melbourne puts the median start of the wet season at May 28 for Melbourne and May 26 for Vero Beach. In some years it slips into June, and in 1998 it did not begin until early July.
How hot is May in Palm Bay?
May afternoons at the Palm Bay co-op station normally reach 86.6 degrees, with 65.4 at dawn, on the 1991 to 2020 normals. Melbourne International Airport runs 84.9 and 68.6 and averages 4.5 May days of 90 or hotter.
What was the warmest May on record in Melbourne, Florida?
May 2026, which averaged 80.6 degrees at Melbourne International Airport and beat the 80.3 of May 2024. The month included a daily record high of 97 on May 9 and a low of 80 on May 26, the all-time record warm minimum for May at the site.
When does hurricane season start for South Brevard?
The Atlantic hurricane season runs from June 1 to November 30, according to the National Hurricane Center, with activity peaking around September 10. May is the month to check the evacuation zone for a home in Palm Bay, Micco or Barefoot Bay and to buy supplies.
Sources
- NOAA Regional Climate Centers ACIS, 1991-2020 monthly normals, Palm Bay cooperative station (USC00086761) https://data.rcc-acis.org/StnData?params=%7B%22sid%22%3A%22086761%22%2C%22sdate%22%3A%222020-01%22%2C%22edate%22%3A%222020-12%22%2C%22elems%22%3A%5B%7B%22name%22%3A%22maxt%22%2C%22interval%22%3A%22mly%22%2C%22duration%22%3A%22mly%22%2C%22reduce%22%3A%22mean%22%2C%22normal%22%3A%2291%22%7D%2C%7B%22name%22%3A%22mint%22%2C%22interval%22%3A%22mly%22%2C%22duration%22%3A%22mly%22%2C%22reduce%22%3A%22mean%22%2C%22normal%22%3A%2291%22%7D%2C%7B%22name%22%3A%22pcpn%22%2C%22interval%22%3A%22mly%22%2C%22duration%22%3A%22mly%22%2C%22reduce%22%3A%22sum%22%2C%22normal%22%3A%2291%22%7D%5D%7D Used for: May normal high, low and rainfall in Palm Bay
- NOAA Regional Climate Centers ACIS, 1991-2020 monthly normals, Melbourne International Airport (USW00012838) https://data.rcc-acis.org/StnData?params=%7B%22sid%22%3A%22USW00012838%22%2C%22sdate%22%3A%222020-01%22%2C%22edate%22%3A%222020-12%22%2C%22elems%22%3A%5B%7B%22name%22%3A%22maxt%22%2C%22interval%22%3A%22mly%22%2C%22duration%22%3A%22mly%22%2C%22reduce%22%3A%22mean%22%2C%22normal%22%3A%2291%22%7D%2C%7B%22name%22%3A%22mint%22%2C%22interval%22%3A%22mly%22%2C%22duration%22%3A%22mly%22%2C%22reduce%22%3A%22mean%22%2C%22normal%22%3A%2291%22%7D%2C%7B%22name%22%3A%22pcpn%22%2C%22interval%22%3A%22mly%22%2C%22duration%22%3A%22mly%22%2C%22reduce%22%3A%22sum%22%2C%22normal%22%3A%2291%22%7D%5D%7D Used for: May normals at KMLB; June comparison
- NOAA Regional Climate Centers ACIS, 1991-2020 monthly normals, Vero Beach airport (USW00012843) https://data.rcc-acis.org/StnData?params=%7B%22sid%22%3A%22USW00012843%22%2C%22sdate%22%3A%222020-01%22%2C%22edate%22%3A%222020-12%22%2C%22elems%22%3A%5B%7B%22name%22%3A%22maxt%22%2C%22interval%22%3A%22mly%22%2C%22duration%22%3A%22mly%22%2C%22reduce%22%3A%22mean%22%2C%22normal%22%3A%2291%22%7D%2C%7B%22name%22%3A%22mint%22%2C%22interval%22%3A%22mly%22%2C%22duration%22%3A%22mly%22%2C%22reduce%22%3A%22mean%22%2C%22normal%22%3A%2291%22%7D%2C%7B%22name%22%3A%22pcpn%22%2C%22interval%22%3A%22mly%22%2C%22duration%22%3A%22mly%22%2C%22reduce%22%3A%22sum%22%2C%22normal%22%3A%2291%22%7D%5D%7D Used for: May reference normals for Micco and Barefoot Bay
- NWS Melbourne climate report for the month of May 2026, Melbourne (CLMMLB, issued June 1, 2026; Iowa Environmental Mesonet text archive) https://mesonet.agron.iastate.edu/cgi-bin/afos/retrieve.py?pil=CLMMLB&sdate=2026-06-01&edate=2026-06-03&fmt=html&limit=1 Used for: May records, hot days, rainfall, May 2026 and 2025 values at KMLB
- NWS Melbourne climate report for the month of May 2024, Melbourne (CLMMLB, issued June 1, 2024; Iowa Environmental Mesonet text archive) https://mesonet.agron.iastate.edu/cgi-bin/afos/retrieve.py?pil=CLMMLB&sdate=2024-06-01&edate=2024-06-03&fmt=html&limit=1 Used for: May 2024 and 2023 values at KMLB
- NWS Melbourne, May 2026 and Spring 2026 Weather Summary, page 3 https://www.weather.gov/media/mlb/summary/MaySpring2026.pdf#page=3 Used for: warmest May on record at Melbourne
- NWS Melbourne, May 2026 and Spring 2026 Weather Summary, page 5 https://www.weather.gov/media/mlb/summary/MaySpring2026.pdf#page=5 Used for: Melbourne May 2026 records
- NWS Melbourne, May 2026 and Spring 2026 Weather Summary, page 9 https://www.weather.gov/media/mlb/summary/MaySpring2026.pdf#page=9 Used for: May 2026 rainfall by station
- NWS Melbourne, May 2026 and Spring 2026 Weather Summary, page 11 https://www.weather.gov/media/mlb/summary/MaySpring2026.pdf#page=11 Used for: second warmest spring at Melbourne and Vero Beach
- NWS Melbourne, Wet/Dry Season Onset https://www.weather.gov/mlb/wetdry Used for: median start of the wet season at Melbourne and Vero Beach
- NWS Melbourne, The Onset of the Wet and Dry Seasons in East Central Florida, page 1 https://www.weather.gov/media/mlb/climate/wetdryseason.pdf#page=1 Used for: late May rise in rain frequency; 1998 delay
- NWS Melbourne, The Onset of the Wet and Dry Seasons in East Central Florida, page 4 https://www.weather.gov/media/mlb/climate/wetdryseason.pdf#page=4 Used for: hottest month on record at Melbourne in June 1998
- NWS Melbourne, Florida lightning climatology by month https://www.weather.gov/mlb/fl_lightning_climo Used for: May lightning and sea breeze storms
- Florida Department of Agriculture and Consumer Services, Florida Forest Service: KBDI as an Indicator of Potential Wildfire Activity https://www.fdacs.gov/Forest-Wildfire/Wildland-Fire/Keetch-Byram-Drought-Index-KBDI/KBDI-as-an-Indicator-of-Potential-Wildfire-Activity Used for: fire activity peak in May and June
- NWS Melbourne, Florida Hazardous Weather Events in May, page 1 https://www.weather.gov/media/mlb/whirl/FloridaHazardousWeather_May.pdf#page=1 Used for: May 1964 Roseland thunderstorm winds
- NWS Melbourne, Florida Hazardous Weather Events in May, page 2 https://www.weather.gov/media/mlb/whirl/FloridaHazardousWeather_May.pdf#page=2 Used for: May 8, 1977 storms in Brevard and Indian River
- NWS Melbourne, Florida Hazardous Weather Events in May, page 6 https://www.weather.gov/media/mlb/whirl/FloridaHazardousWeather_May.pdf#page=6 Used for: May 30, 1996 Sebastian airport; May 31, 1991 hail in Brevard
- National Hurricane Center, Tropical Cyclone Climatology https://www.nhc.noaa.gov/climo/ Used for: Atlantic season dates and average activity
- Florida Department of Revenue, Tax Information Publication 25A01-05, New Sales Tax Exemptions Beginning August 1, 2025 https://floridarevenue.com/taxes/tips/Documents/TIP_25A01-05.pdf Used for: storm supplies now always exempt
- Florida Division of Emergency Management, Disaster Preparedness Maps https://www.floridadisaster.org/planprepare/disaster-preparedness-maps/ Used for: Know Your Zone evacuation lookup
- NOAA NCEI Coastal Water Temperature Guide, all stations table https://www.ncei.noaa.gov/access/coastal-water-temperature-guide/all_table.html Used for: May water temperatures at Trident Pier and the Canaveral buoy
How this page was made
Digital Towns uses AI assistance to research and write its guides, and every page is only as good as the sources it cites. Our goal is the most accurate, useful local information possible.
This page was fact-checked twice before publishing.
If you see an error, or anything you can show is false, tell us right away and we will take a third look.
Report an error
Thank you. We'll take a third look and correct the page if it's wrong.